2026-08-08
Are Pokemon Cards an Asset Class?
Robert Greer's 1997 asset-class framework, a 3,821% index number that falls apart once you see how it is built, and PSA population data that quietly undercuts the "vintage is scarce" argument
Pokemon cards are having a real moment right now. New sets (themed card collections the company releases every few months, the way a card game keeps putting out new expansions) keep landing: the Chaos Rising and Mega Evolution series launched in May 2026, on top of Prismatic Evolutions and the 151 reprint set before it. The headlines keep getting bigger too. In February 2026 a single card, the Pikachu Illustrator (an ultra-rare 1998 promotional card long considered the rarest Pokemon card in existence), sold at auction for $16.49m, becoming the most expensive trading card ever sold in any category, a record certified by Guinness. Buyers spent an estimated $450m on Pokemon cards in the first quarter of 2026 alone, and PSA, the company that authenticates and grades cards, is now processing roughly 90,000 cards a day, up from about 15,000 a day back in 2021.
That kind of money and attention has pushed cards well past being just a hobby. People are increasingly buying them the way they would buy a stock or a piece of art: as something to hold and hope to sell later for more. So the question worth asking properly is whether Pokemon cards actually are an asset class, in the same sense that stocks, bonds, or gold are, or whether that is a label the current hype is borrowing without really earning.
The short version is this. Pokemon cards do sit inside a real, recognized category of assets, so the classification question is not really the interesting one. What they are not is something worth building a portfolio around the way a stock or bond is, and the headline return figure behind most of the bullish case falls apart once you look at how it is actually built. The most surprising part is that the "vintage cards are scarce because they cannot be reprinted" argument, widely assumed to be true, does not hold up against the actual data on how many of them are getting graded.

1st Edition Fossil Psyduck (#53/62)
What counts as an asset class
The key reference point here is a 1997 paper by Robert Greer, a finance academic, in the Journal of Portfolio Management. It is still considered the standard definition, and he revisited it himself in 2018. Greer defines an asset class as a group of things that share real economic similarities with each other, and that are clearly different from things outside the group. When he revisited the idea two decades later, he added an important condition: the group should be things people can actually invest in, not just things that exist. That distinction ends up mattering a lot here.
Greer splits everything worth owning into three broad groups. The first, capital assets, pays you back over time (for example, stocks pay dividends and bonds pay interest), so you can work out roughly what one is worth today by estimating those future payments. The second, consumable or transformable assets, gets used up, like oil, copper, or wheat, and its price comes mainly from ordinary supply and demand rather than any future income. The third, store of value assets, pays nothing and cannot really be used up either, but people still want to own it. Greer's own example of this third group is fine art.
Pokemon cards fall into that third group. A card produces no income, so there is no way to value one by forecasting future payments the way you would value a stock. Its price is purely whatever the next buyer is willing to pay. That makes it a genuinely different kind of asset from a stock, which is why the tools used to value a company do not really apply here.
When AJ Scaramucci, founder of Solari Capital, went on CNBC nine days after paying $16.49m for the only Pikachu Illustrator ever to receive a PSA 10 (PSA grades a card's condition on a 1-to-10 scale, and 10 is the highest, most pristine grade a card can get) and said cards should be treated as investments, he was really answering "is this worth buying," not the separate question of what category of asset it technically is. Something can be genuinely worth buying and still be a store of value asset rather than anything resembling a stock. Gold works the same way.
Greer's framework has one more useful piece. He argues that a real bubble, prices running well past what something is actually worth, needs two things to happen together: there has to be no reliable way to check the item's true value, and there has to be a real limit on how much of it exists. Store of value assets like art and cards can have both problems at once. Commodities like oil usually do not, because if the price runs too high, more can simply be produced. Whether something's supply is genuinely limited or not turns out to be the whole story behind the difference between old and new Pokemon cards later in this piece.
Where the big number comes from
The bullish case for Pokemon cards runs on one statistic. Card Ladder, a company that tracks and publishes price data for trading cards the way an index provider tracks stock prices, reports its Pokemon index up 3,821% since 2004, against 483% for the S&P 500 over the same span. Fortune magazine, using data Card Ladder supplied directly, ran a slightly different version: the average Pokemon card gained 3,261% over twenty years while the S&P 500 returned 421%. By April 2026 the same Card Ladder index was being quoted at 6,208% since 2004.
Those three figures are all attributed to the same tracker and the same underlying market, separated by only months. The index did have a genuinely enormous year, up 145% over the twelve months to February 2026 against 15.2% for the S&P 500, so the jump is arithmetically possible rather than an error. But an index adding more than half of its entire twenty-one-year gain in a few months is not really behaving like a broad market benchmark. It looks more like the kind of move a single, volatile stock might make.
What actually explains this is the methodology, and it is worth walking through. Card Ladder publishes how its index works: every card in a given index is marked at its last sold price (whatever it went for on the most recent day it actually traded), and the sum is divided by the number of cards. That creates three problems at once.
The first is stale pricing. A card that last changed hands in 2019 is still carried at its 2019 price until someone trades it again. This is the same effect that makes private equity and real estate indexes look artificially smooth, and it flatters the index's apparent risk without any real property of the underlying asset actually changing.
The second is that the index only marks down when people actually sell. In a falling market, collectors tend to stop listing things, since nobody enjoys locking in a loss on something they also just enjoy owning. So the index does not fall, it just stops updating. Anyone who has looked at other hard-to-trade asset indexes will recognize this as the reason they always look smoother than what is really happening underneath.
The third is that the index is not something anyone could actually buy. Every card counts equally regardless of how valuable it is, rather than being weighted by real market value, so the index is not a portfolio anyone could hold, and there is no fund or tracker that replicates it. Greer's point about investable assets applies directly here.
Card Ladder is upfront about how fragile this can be. Their own documentation walks through an example where one million-dollar sale can lift an entire player's index by 50% while nothing else in it actually changes value, and they describe that themselves as a distortion that defeats the point of the index. That is a genuinely candid disclosure from the people who built it, but it is also a warning most people citing the 3,821% figure have clearly not read.
The clearest criticism of the comparison itself came from analyst Bo Hanson, who called the S&P framing a "math crime," since it stacks an average across thousands of collectible cards against a diversified index of five hundred real companies. His point is that the fairer comparison is to individual stock winners, not to the market as a whole. Over roughly the same two decades, an S&P 500 tracker fund (SPY) returned 509.56% from July 2006 to July 2026, and that number comes with daily liquidity, dividends, and a bid-ask spread measured in fractions of a cent.
What happens when you correct for selection bias
This is where research on the art market becomes directly useful, because art is the store of value asset that has actually been studied properly by academics.
Research by Goetzmann in the 1990s established that sales in these markets are not random. The owner decides when to sell, and owners are far more likely to sell something that has gone up in value, so the sales anyone actually observes are skewed toward winners rather than being a fair sample of the whole market. His sharpest finding was that in periods with few sales, an index can show strong positive returns even while the true value of everything in that market is actually falling.
Korteweg, Kraussl, and Verwijmeren put real numbers on this in the Review of Financial Studies, using 20,538 paintings that sold more than once at auction between 1972 and 2010. Correcting for that selection bias cut the average annual return from 11% to 7%, and cut the Sharpe ratio (a standard measure of how much return an investment delivers for each unit of risk taken; a higher number means a smoother, more efficient ride) from 0.4 to 0.1. Their conclusion was blunt: passively investing in an index of paintings is not a workable strategy once this bias is accounted for, and they specifically noted the finding applies to other hard-to-trade assets that work the same way.
Trading cards work exactly the same way. The card index is built only from cards that actually sold, in a market that is far more retail and far more driven by sentiment than the auction market for paintings. If a correction this large applies to twenty thousand paintings studied across four decades, there is no real reason to expect Card Ladder's Pokemon index needs a smaller one. If anything it may need a larger correction, since most of the drop in the Sharpe ratio in the art study came from correcting understated volatility, and an index built only from last-sold prices understates volatility more than the method those researchers used.
The Charizard case study below makes the point better than the theory does on its own. PSA checks a card's centering, corners, edges, and surface condition to arrive at its grade, and a 10 is nicknamed "gem mint": as close to a perfect, flawless copy as the scale allows. The card itself is the PSA 10, first edition (from the first, smaller print run, generally the most valuable version of a card) Base Set (the original 1999 English-language Pokemon card set, still the most collected set in the hobby) Charizard, the single most tracked individual card in the hobby. Its real sale history is a useful test of whether this is actually a boring, stable thing to own.
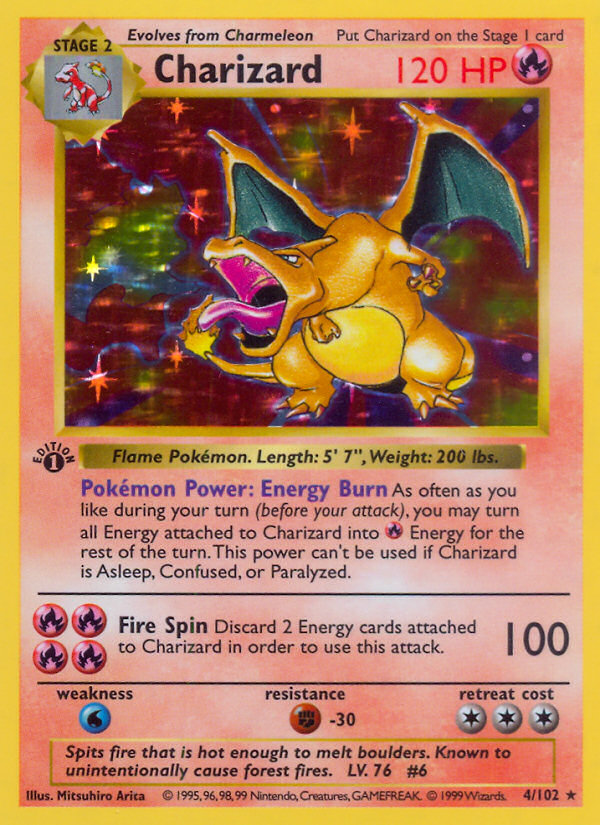
1st Edition Base Set Charizard (#4/102)
The card behind every number in this section. Real card art, via TCGdex, the same source this site's pricing data comes from.
| Date | Price | Note |
|---|---|---|
| July 2017 | $18,900 | Real sale, PWCC/eBay (Beckett News) |
| — | — | No publicly recorded PSA 10 sale of this card anywhere between 2017 and 2021, per data tracker Card Ladder |
| October 2020 | $220,000 | PSA 10 sale |
| November 2020 | $295,000 | One month later |
| March 2022 | $420,000 | Pandemic-era peak |
| November 2022 | $250,000 | Post-peak correction, roughly -40% |
| December 2025 | $550,000 | New all-time public auction record, Heritage Auctions |
Real reported sale/valuation points; gaps between them are real reporting gaps, not smoothed.
During the gap between 2017 and 2020, the index simply carried the card at its last sale price and showed no movement at all, even though that is not really the same thing as being stable. That gap, and the sharp correction that followed the 2022 peak, is Goetzmann's point made visible in a single card.
The comparison people always want is the $30 one. Thirty dollars in the S&P 500 in January 1999, with dividends reinvested, is worth roughly $261 today. Thirty dollars spent on a Charizard that later graded PSA 10 would be worth $550,000 today, around 18,000 times the money. Worth keeping in mind: this is the single most extreme surviving outcome out of billions of printed cards, and the 1999 entry price is an assumption about what a pack or a raw, ungraded card cost at the time, not a documented sale.
Log scale: the two lines end nearly 2,000x apart. Hollow/dashed dot = the stated $30 entry assumption, not a documented sale; filled dots are real reported sales. See below for exactly what is and is not verifiable here.
The costs nobody puts in the comparison
Return comparisons between cards and stocks almost always ignore costs that are trivial in one market and large in the other.
At Heritage Auctions, one of the largest auction houses for cards and collectibles, the buyer's premium (an extra fee added on top of the winning bid, called the hammer price) runs 20% on most lots, and sellers have historically paid a further 10% to 15% in commission. Goldin, another major cards and memorabilia auction house, charges buyers a similar 20%. Getting a card professionally graded by PSA in 2026 costs anywhere from about $25 to $600 depending on the tier and the card's declared value, and once membership and shipping are added, a bulk submission typically runs closer to $30 to $35 per card. Auctions also do not pay out immediately: settlement usually takes 30 to 60 days after the sale.
Put a full round trip through those numbers. Buy at auction and later sell at auction at the exact same hammer price: the buyer pays 1.20 times the hammer price, and the seller receives somewhere between 0.85 and 0.90 times it. Using the midpoint, the hammer price has to rise about 37% just to break even. Spread over a three-year hold, that is roughly 11% a year of pure cost before any real gain shows up. The equivalent drag on an S&P 500 index fund is a fee of a few hundredths of a percent and a spread that is barely worth measuring.
The record-breaking sale itself shows what this does to a headline number. Logan Paul bought the Illustrator card in 2021 for a reported $5.275m and sold it in February 2026 for $16,492,000, which looks like a 3.13x gain, about 28% a year. But that $16.49m figure includes the buyer's premium, so it is not what actually landed in the seller's account. At a 20% premium, the real hammer price was closer to $13.7m, and even assuming Paul paid zero seller commission, an unusually good deal, his actual return drops to roughly 2.6x, about 23% a year. That is still an excellent trade, but it is about five percentage points a year worse than the number that got widely reported, on the single highest-profile sale in the history of this market, made by a seller with about as much negotiating leverage as anyone in this space will ever have, and most other sellers realistically do worse.
How this compares to collectibles that already have a track record
If Pokemon cards really are a store of value asset, the fairer comparison group is not the S&P 500. It is art, wine, watches, and classic cars: categories that already have decades of price history and real institutional buyers.
Knight Frank, a real estate and luxury-assets firm, publishes a Luxury Investment Index that tracks ten of these categories together. It fell 3.3% in 2023, 2.7% in 2024, and 0.4% in 2025, which the firm itself described as a leveling-off after two rough years rather than a recovery. The Liv-ex Fine Wine 100 index dropped a further 2.5% in 2025 and sits roughly 25% below its 2022 peak. Over ten years, rare whisky is up about 192% and fine wine about 54%. The broader art market, meanwhile, grew 4% in 2025 to $59.6bn in global sales, with US auction sales up 23%.
So the entire established world of passion investments has been flat to falling for three years running, in the same window Pokemon cards allegedly returned 145% in twelve months. There are two ways to read that. Either Pokemon cards move completely independently of every other collectible category, which would make them an extraordinary diversifier and is a genuinely large claim to make, or the two sets of numbers are simply measuring different things. The methodology reasons above point toward the second explanation.
Knight Frank is careful about this in a way card trackers generally are not. The firm states plainly that its index is a price index built from dealer and auction data, not something anyone can actually invest in directly. That is the right disclosure for this type of index, and its absence from most Pokemon commentary says something.
The market has already split in two
Treating "is this a bubble" as some future question stops making sense on a closer look at 2026 data, because for half of this market, it has already been answered.
Modern cards, meaning sets from roughly the last three years, corrected hard starting in late 2025. A Prismatic Evolutions Umbreon ex (an "ex" card is a stronger, harder-to-pull version of a Pokemon) Special Illustration Rare (an especially detailed, high-rarity art treatment) fell from about $1,600 to $832. An Obsidian Flames Charizard ex went from $126 to $79. Cards are sold sealed, meaning still unopened, in booster packs (a handful of random cards) and booster boxes (a case of those packs), or in Elite Trainer Boxes, a bundle of packs plus accessories: Phantasmal Flames booster boxes dropped from $305 to $275 in ten days, Elite Trainer Boxes fell from $120 to $90, and sealed product generally is down 15% to 25% since March 2025. Independent trackers put modern single cards somewhere between 20% and 50% below their 2024-to-2025 peaks.

Charizard ex (Obsidian Flames, 2023)
The card that fell from $126 to $79 in the same window.

Umbreon ex SIR (Prismatic Evolutions, 2025)
The card that fell from $1,600 to $832 in a matter of weeks.
Vintage cards did the opposite over the same months. The Base Set Charizard above set its own record in December 2025. The Illustrator sale in February 2026 became the most expensive trading card ever sold in any category. Sealed Base Set booster boxes, unopened original packs from 1999, cleared $400,000 at auction. Buyers still spent around $450m on Pokemon cards in the first quarter of 2026, so this is not a market where demand simply disappeared.
The usual explanation is supply. The Pokemon Company printed 11.9 billion cards in the year to March 2024 and 10.2 billion in the year to March 2025, with cumulative production passing 85 billion in May 2026: roughly 40% of every Pokemon card ever made came out in just the last three years.
Every point is a real, disclosed figure. This only covers 2020 onward because that is as far back as continuous public data actually goes (see below).
A modern chase card (the single most sought-after card in a set, the one everyone hopes to pull) has supply that can grow to meet demand, because the company can simply print more of that set (a new Millennium Print Group printing facility is adding capacity for exactly this). A 1999 card cannot be reprinted.
That is where most commentary on this stops, one step too early.
Why the "vintage is scarce" argument is weaker than it looks
The print run of a 1999 card is fixed, that much is true. But the print run is not actually what determines its price. What determines the price is the number of copies sitting in a PSA 10 holder (the sealed plastic case a graded card ships in), because that specific object, a card that has already been graded a perfect 10, is what actually trades at the headline prices, and that population is created by a grading company, not by Nintendo.
The PSA population report, the running public count of how many copies of each card PSA has graded at each score, is the data that actually undermines that assumption. Over one recent thirty-day window, Base Set Charmander gained 2,661 newly graded PSA 10s to reach 3,638 total, meaning the number of gem mint copies of a 1999 card grew by around 270% in a single month. Base Set Bulbasaur added 1,860 to reach 2,220, a rise of more than 500%. Charmeleon added 1,261 to reach 1,565. Squirtle added 1,179 to reach 2,131. None of these are modern reprints. They are cards printed in 1999 whose actual tradeable supply more than doubled, in some cases more than quintupled, in under a month.
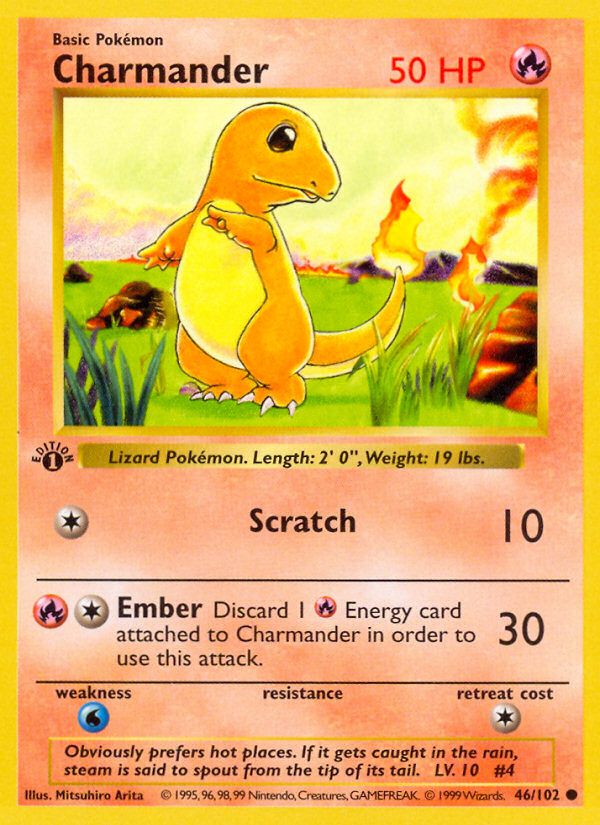
Charmander

Bulbasaur
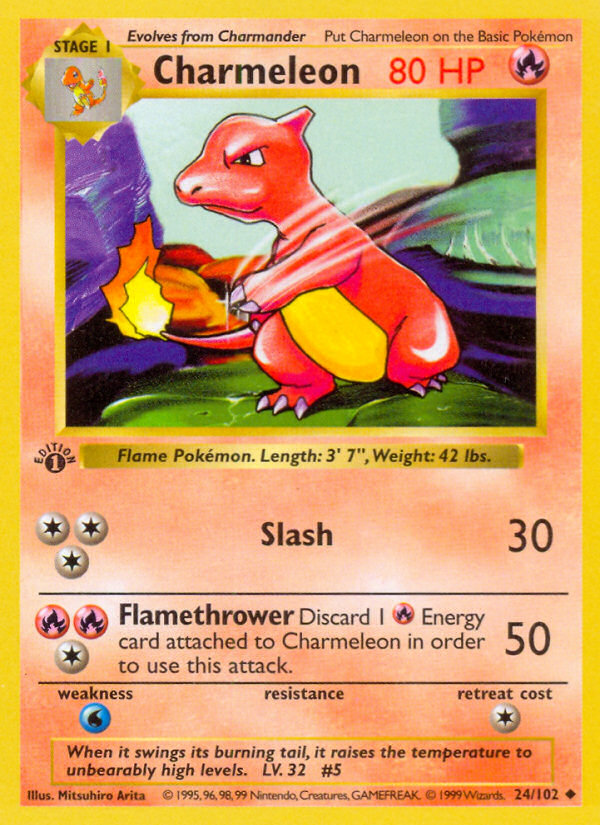
Charmeleon
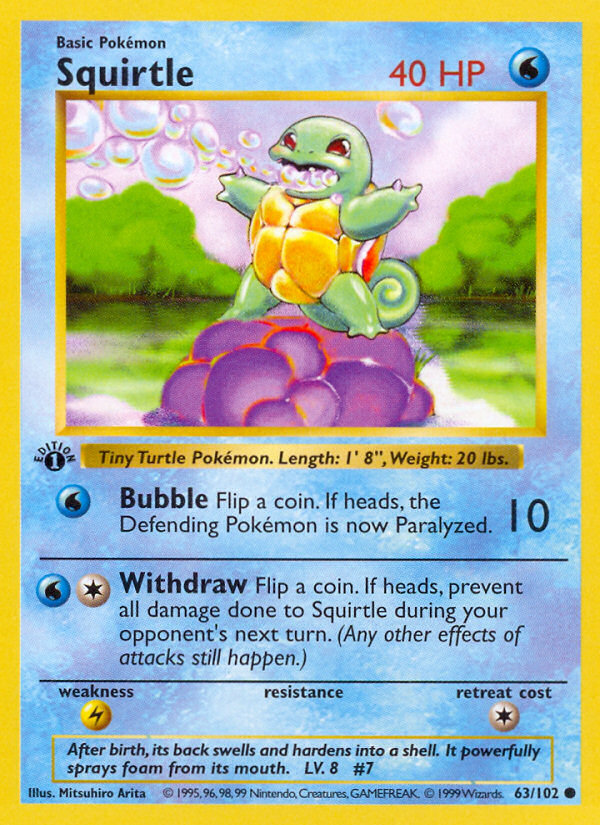
Squirtle
Real PSA population-report figures for four 1999 Base Set cards, one recent 30-day window. Part of this is PSA clearing a submission backlog rather than a steady run rate, but the direction is real: the gem-mint population of a 1999 card can more than double, in some cases more than quintuple, in a month.
That data deserves a careful read rather than an overreaction. Some of that jump is almost certainly PSA working through a backlog of submissions rather than a steady ongoing rate, and the population report counts each submission, so a card that gets cracked out of its holder and resubmitted can be counted twice. But the direction is not in question: PSA is grading around 90,000 cards a day now, against about 15,000 a day in 2021, and the people who publish this data flag it themselves as fresh supply working its way into a market that assumes scarcity.
What is actually happening is that grading turns a raw card, which nobody has really priced yet, into a graded card, which trades at a specific number. Every ungraded 1999 Charizard sitting in someone's binder is effectively a claim on future supply, and rising prices are exactly what pulls it out and into the graded market. That is a supply curve that responds to price. It is slower and messier than a printing press, but it is not fixed.
The gap becomes obvious once two cards with almost the same number of submissions are compared. The Base Set Charizard has been graded about 101,139 times, and only around 122 of those came back a PSA 10, a gem rate (the share of submitted cards that come back a perfect 10) near 0.1%. The Charizard ex from the 151 set has been graded about 99,517 times, with a gem rate around 28%, close to 28,000 PSA 10s. Same character, almost identical submission numbers, and a gem-mint population more than two hundred times larger for the newer card.

Charizard ex (151, 2023)
The other Charizard in the gem-rate comparison below: almost the same submission count as the 1999 card above, a gem-mint rate more than two hundred times higher.
Same character, near-identical PSA submission counts (about 101,000 vs. 99,500), and a gem-rate gap of more than two hundred times. That gap, not the year on the card, is most of what a buyer is actually paying for.
That gap, not the year printed on the card, is the real driver of what someone buying vintage is actually paying for.
Putting that back through Greer's framework: a real bubble needs both no reliable way to check true value, and a genuine limit on supply. Modern cards have the first problem but not the second, which is exactly why their speculative premium unwound so quickly once print runs caught up with demand. Vintage graded cards have the first problem and appear, on the surface, to have the second too, which under Greer's logic actually makes them the segment most exposed to a shift in sentiment, not the safer half. The population data suggests the real supply constraint is looser than the story implies. That does not make vintage a bad place to be. It means vintage has been earning the price premium that comes with fixed supply, while the actual graded supply keeps growing underneath it.
You cannot really invest in this directly
Even setting the return numbers aside, there is no clean way to actually put money into this market the way you can buy a stock.
Pokemon is owned in roughly equal thirds by Nintendo, Game Freak, and Creatures Inc, run day to day through their joint venture, The Pokemon Company. Nintendo holds 32% of the voting rights. The Pokemon Company's own numbers for the year to February 2026 were a record: net sales of ¥531.4bn, up 29.3%, operating profit of ¥144.0bn, up 43.0%, and net profit of ¥120.1bn, up 70.7%. Profit growing faster than revenue is exactly what you would expect from a licensing business that does not have to spend much extra to earn each additional dollar. Those figures became public through a filing in Kanpo, the Japanese government's official gazette, rather than through a normal investor report, and exactly how revenue and profit get split between The Pokemon Company and its three owners is not disclosed.
Only Nintendo is publicly listed, and it does not break out Pokemon's numbers separately. The one place the card boom shows up in a public stock is Nintendo's "equity method investment income" line (its share of profit from partly-owned businesses like The Pokemon Company), which reached ¥82.8bn in the year to March 2026, roughly triple the year before. That is real exposure to the boom, but it is mixed in with a huge Switch 2 console launch and everything else Nintendo does.
Nintendo's own stock (NTDOY) reflects that blended picture.
The grading side of this market is private too, and consolidating fast. PSA's parent company went private in 2021 for around $853m, backed by an investor group including hedge fund manager Steve Cohen, then raised further money at a $4.3bn valuation by 2022. Its main competitor, CGC, was majority bought by Blackstone's Tactical Opportunities investment arm. Given everything above about grading being the real supply mechanism in this market, the fact that the two companies controlling it are owned by a hedge fund founder and a private equity giant, with no way for an ordinary investor to buy in, is not a small detail.
People have also tried letting investors buy small, tradeable shares of a single expensive card: essentially the same idea as a stock, but for one card. It has mostly gone badly. Otis let people buy fractional shares of a Charizard valued at $236,800; the company was bought by Public.com in 2022 and then shut down, with investors reportedly taking a loss. Collectable, a platform structured as a small-scale public offering under SEC rules, has reported returns of roughly 3.1% a year since it launched, well below the estimated 6% to 8% a year for top-tier cards generally over the same stretch, meaning the actual product built to let people invest in this market has underperformed the market it was tracking, after fees. A third platform, Dibbs, abandoned the fractional-ownership model entirely in 2024.
The clearest example of how badly this can go is attached to the record sale itself. Before the Illustrator card was auctioned, about 5.4% of it had already been sold off in small shares through a platform called Liquid Marketplace, which then collapsed. Based on the eventual $16.49m sale price, that 5.4% stake would now be worth roughly $890,000. As of April 2026, it remains unresolved whether the people who bought those shares will actually be paid: Logan Paul's side maintains the full proceeds are his. So the single most successful trade in the history of this market left the one group of people who had actually tried to own a piece of it properly caught in a legal dispute over money they may never see.
Where I land
Strictly by the textbook definition, Pokemon cards are an asset class. They are store of value assets under Greer's framework, they share real economic characteristics with each other, and those characteristics are genuinely different from a stock's or a commodity's. Anyone dismissing them as just a toy is wrong: the production and grading data settles that comfortably. Three decades in, demand is still growing, the franchise's owner just posted its best year on record, and there is real third-party authentication infrastructure underneath this market rather than self-reported numbers.
As something to actually put money into, I do not think the case holds up treating this as one single asset class the way "buy the S&P 500 and hold it" treats the stock market. The headline return figure comes from a stale-priced, equal-weighted index built only from cards that happened to sell, in a market where people sell their winners and quietly keep their losers. The one real academic correction available for that kind of bias, from a much better documented market, cut annual returns by four percentage points and cut risk-adjusted returns by three quarters. Round-trip buying and selling costs alone require close to 37% price appreciation just to break even. Every other established collectible category with a long track record has been flat or falling for three years running.
My actual view is that "is Pokemon overvalued" is close to being the wrong question, because it treats the whole market as one thing when the data above shows it clearly is not. Real judgment here means looking card by card and set by set, not index by index, at which specific characters and cards people genuinely want to keep owning versus which ones are riding a single hyped set. Modern chase cards have shown exactly how fast that kind of hype can reverse: an Umbreon ex Special Illustration Rare fell 48% in a matter of weeks, and a Charizard ex from a different modern set lost more than a third of its value over the same stretch. That is not a stable place to put money. It is a market repricing a chase card the moment collectors move on to whatever set comes next.
Vintage cards, and especially sealed, unopened vintage product, have behaved differently, at least so far. The same months that punished modern chase cards saw the Base Set Charizard set a new all-time high, the Illustrator become the most expensive trading card ever sold in any category, and sealed 1999 Base Set booster boxes clear $400,000 at auction. If I were putting money into this space at all, that is where I would look first: established, high-grade vintage singles and unopened vintage product, not whatever set just launched.
But I would not treat that as a permanent rule, and this is the part most people writing enthusiastically about vintage right now seem to miss. The population data earlier in this piece is a real warning sign specifically for vintage: the number of gem-mint copies of a 1999 card is growing fast, even though the print run itself cannot. Vintage has earned real trust over the past few years, but the one thing actually underpinning that trust, a fixed, countable supply, is quietly less fixed than the price charts suggest.
Sources
- What is an Asset Class, Anyway? — Robert Greer, Journal of Portfolio Management, 1997
- The Superclasses of Assets Revisited — J.P. Morgan Center for Commodities, 2018
- Does it Pay to Invest in Art? A Selection-Corrected Returns Perspective — Korteweg, Kraussl, and Verwijmeren, Review of Financial Studies
- How Costly is the Fall From Fashion? Survivorship Bias in the Painting Market — Goetzmann, 1996
- Collectibles: Trading Cards and the Price of Perfection — Andrew Keenan, CAIA Association, December 2021
- Card Ladder index and value methodology
- Pokemon Cards Beat the S&P 500 by 2.5x, But the Math Is a Lie — 24/7 Wall St., 18 July 2026
- Are collectibles a viable asset class? The buyer of the $16.5 million Pokemon card thinks so — CNBC, 25 February 2026
- Knight Frank Wealth Report 2026 and Luxury Investment Index, April 2026
- Art Basel and UBS Global Art Market Report 2026
- The Pokemon Company FY2026 results, filed in Kanpo — reported by Dr. Serkan Toto, 1 June 2026
- Collectors Holdings (PSA parent) $4.3bn valuation — Sportico
- Blackstone acquires CGC's parent — press release
- Logan Paul's Pikachu Illustrator sells for record $16.5M at auction — KSAT
- PSA population data via CardTrack and GemRate, 2026
- Trading card portfolio returns 2021 to 2023 — College of Wooster independent study, 2024
- PokemonPriceTracker, Nerdbeak, and PullRate market reporting, 2026